Water Plan Data and Tools

A visitor checks out DWR’s augmented-reality sandbox at National Groundwater Awareness Week event in Sacramento CA. March 2023.
As part of the development of the California Water Plan, models, data, and tools, are used and created to develop its content. These models, data, and tools, are provided below for use and further development as part of water management in the state.
The California Water Plan provides an accounting of water that enters and leaves the state and how it is used and exchanged between the regions. This is important to all water planning activities. Water portfolio data provides information for comparison about how water uses and sources of supply can vary between wet, average, and dry hydrologic conditions for each of the California hydrologic regions. The statewide information has been compiled from the 10 California hydrologic regions.
Water Use in California
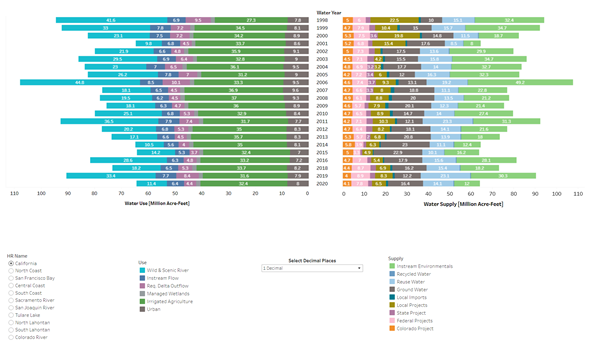
California’s water supplies vary from place to place, season to season, and year to year. The state’s water users (generally environmental, agricultural, and urban sectors) have variable needs for the quantity, quality, timing, and place of use. The California Water Plan has developed water balances to show how water was used by agriculture and urban sectors or dedicated as environmental water and where water came from to provide that water for individual years from 1998-2022. A statewide average is shown below for years 1998-2022.
Water Plan Water Balance Data can be found on CNRA's Open Data Platform.
Where Does California’s Water Go?

- California’s water supports three main sectors: cities and communities, agriculture, and environment.
- On average, the proportion of water used by each sector is 11 percent cities and communities, 42 percent agriculture, and 47 percent environment.
- This statewide ratio varies widely depending upon whether a year is wet or dry. In wet years, the proportion that serves environmental purposes can be 60 percent or more, while in dry years that proportion drops to roughly one-third.
- Water often serves double duty; water allocated for one purpose is often reused for other purposes downstream.
- Water often has multiple benefits across sectors.
Water Supply and Balance Data Interface
As part of DWR's ongoing efforts to document the assumptions, data, analytical tools, and methods used to prepare California Water Plan (CWP) content, DWR has developed an interactive data visualization tool for water balance results in Tableau. The tool provides water balance results at hydrologic regions and state levels for water years (WYs) 1998-2022.
Related Documents
Water Portfolios and Balances — Water portfolios and balances describe the distribution of water throughout the hydrologic cycle, water use by the urban and agricultural sectors, water in the environment, and water supply sources used to meet these uses at the statewide and regional levels.
Update 2023 Water Balances supporting document
Update 2023 Water Balances Automation Standard Operating Procedures
Spatial Patterns of Water Supply and Use in California (escholarship.org)
Webinar Recordings
The Water Plan Team has provided overviews of recently released Water Portfolio Data through online webinars. Recordings for the most recent presentations are available below.
If you have any questions or are looking for other presentations, contact us at cwpcom@water.ca.gov.
Overview
California Water Code Section 10004.6 requires the California Department of Water Resources (DWR) to quantify current and future water conditions in the state. This information is published in the California Water Plan (Water Plan), which is updated every five years. The Water Plan evaluates many alternative future scenarios as an integral part of its analytical approach to quantify system vulnerability under a range of population and urban growth scenarios, land use, and climate uncertainties.
Future Scenarios for Update 2023
For the Update 2023 future scenarios analysis, the decision-scaling approach was applied by stress testing the system across changes in temperature and precipitation. Subsequently, Global Climate Model projections were used to identify the likelihood for future temperature and precipitation changes.
Many of the features of the Water Evaluation And Planning (WEAP) model used by the water plan, called WEAP CVPA, were modified for Update 2023 to improve the water system representation in the model with updated information. These include, along with climate change methodology, Delta biological opinions, Coordinated Operations Agreement, sea-level-rise simulation, expansion of urban lands into native vegetation, and flexible time horizon simulation. Land use, population, water use, and instream flow requirements (IFRs) data in the WEAP-CVPA model were modified for Update 2023 to improve the representation of the observed trends based on updated information.
Future scenarios analysis for Update 2023 includes a suite of metrics designed to identify future water vulnerabilities in specific water sectors. The metrics are grouped into six categories to illustrate the vulnerabilities of the water sectors: surface water; groundwater; agricultural water supply; urban water supply; environmental water; and flood risk. Generally, these metrics are developed by comparing the average 2070 conditions to the average 2020 conditions, and the vulnerability is identified as the increase in adverse conditions in 2070 relative to 2020.
More details can be found in the report From Climate Traces to Climate Insights: Future Scenarios Analysis for the California Central Valley.
Data from the Future scenarios analysis for Update 2023 can be viewed in the Future Scenarios Interactive Data Explorer.
History of Future Scenarios Models for CA Water Plan Updates
- 2009 - WEAP Model for 10 Hydrologic Regions
- Ag, Urban & Environ water demands only
- 3 demographic scenarios (population) through 2050
- Historical hydrology + 12 climate change scenarios (GCM downscale)
- 2013 - Central Valley Planning Area WEAP Model
- integrated supply & demand with Robust Decision Making approach
- 9 demographic scenarios (population & housing density) through 2050
- Historical hydrology + 12 climate change scenarios (GCM downscale)
- Evaluated multiple strategies to diversify regional water portfolios.
- 2018 – Repeat of 2013 analysis with updated climate change scenarios modeled through 2100 (GCM downscale).
- 2023 – WEAP CVPA Model
- Decision Scaling (risk-based climate vulnerability assessments)
- Historic hydrology + 42 climate scenarios - 1100 years for each scenario
- 6 key water metrics reported per scenario
- 2028 –WEAP Model CVFS Model – WEAP CVPA expanded to include other HRs
- Decision Scaling (risk-based climate vulnerability assessments)
- Model Areas expanded and modified to reflect USGS watersheds
- Improved groundwater routine and reporting metrics
- Evaluate adaptation strategies under climate change (Decision Scaling)
Outcome Based Methods and Tools (in development)
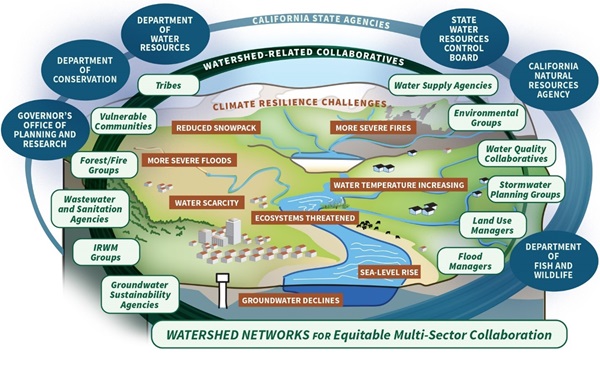
To achieve resiliency and sustainability at the watershed scale, desired outcomes need to be established and progress toward those outcomes needs to be measured over time using performance tracking tools. The goal of performance tracking is to know what direction watershed resilience vital signs are trending.
DWR is developing, as part of the Watershed Resilience Program, a Watershed Hub performance tracking tool. The Watershed Hub will track selected indicators and metrics across relevant water sectors by watershed. It will allow users to see the current risks and vulnerabilities within each watershed and track how adaptation strategies are improving resilience at the watershed scale across the state. Future releases of the Watershed Hub will provide watershed networks with the ability to upload their watershed data, including watershed specific metrics and indicators, project data, and other useful information that may be unique for their networks.

Water Budgets
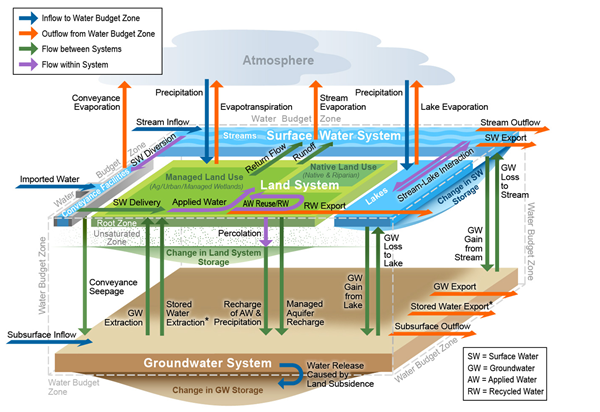
A water budget provides an understanding of historical conditions and how future changes to supply, demand, hydrology, population, land use, and climatic conditions may affect an area. Water agencies use water budgets for a variety of purposes, such as water supply planning and evaluating the effectiveness of water management actions.
The Handbook for Water Budget Development: With or Without Models provides a catalog of methods that a water agency may consider based on their basin setting, needs, availability of data and tools, and expertise. It serves as a technical resource that provides information on a suite of methods and data sources and is provided as technical assistance to parties interested in developing water budgets.
The guidance and methods presented in the Water Budget Handbook can be used to support water planning decisions by resource managers as they assess potential actions to improve the water portfolio and sustainability within their management areas.
Water Plan Data and Tools
The California Water Plan draws from different datasets and tools to develop the content and recommendations included the current Water Plan Update. Below are a list of sources where water data can be found.
- California Data Exchange Center (DWR)
- California's Groundwater Live (DWR)
- Land Use Viewer (DWR)
- Library of Models (DWR)
- Modeling & Analysis (DWR)
- My Water Quality (CalEPA and CNRA)
- Open Data (CNRA)
- SAFER Drinking Water Maps and Data (SWRCB)
- Water Management Planning Tool (DWR)
- Water Use Efficiency Data (DWR)


