Seasonal Maps Provide Snapshot of State Groundwater Levels
DWR engineering geologists Aaron Cuthbertson (right) and Kimberly Bowman measure groundwater levels at a designated monitoring well, one of thousands of wells in California used to generate groundwater level change reports. DWR/2020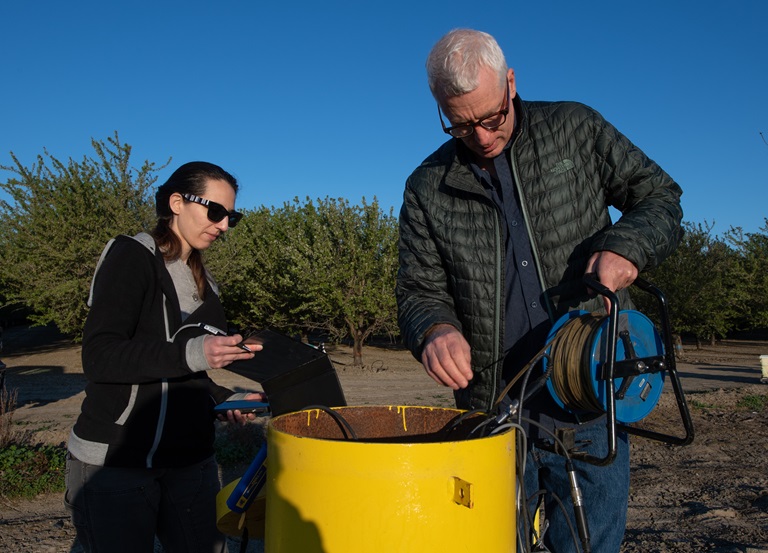
Groundwater is an important resource for Californians because rain and snowfall levels can vary dramatically from year to year. Groundwater provides 40 percent of the state’s water supply in normal years and up to 60 percent in dry years when surface water in lakes, rivers and reservoirs may be reduced.
Surface water is measurable and visually one can see if water levels are low or high or if a river has run dry, but measuring groundwater conditions is more challenging because groundwater is beneath the ground and distributed among the varied layers of aquifers.
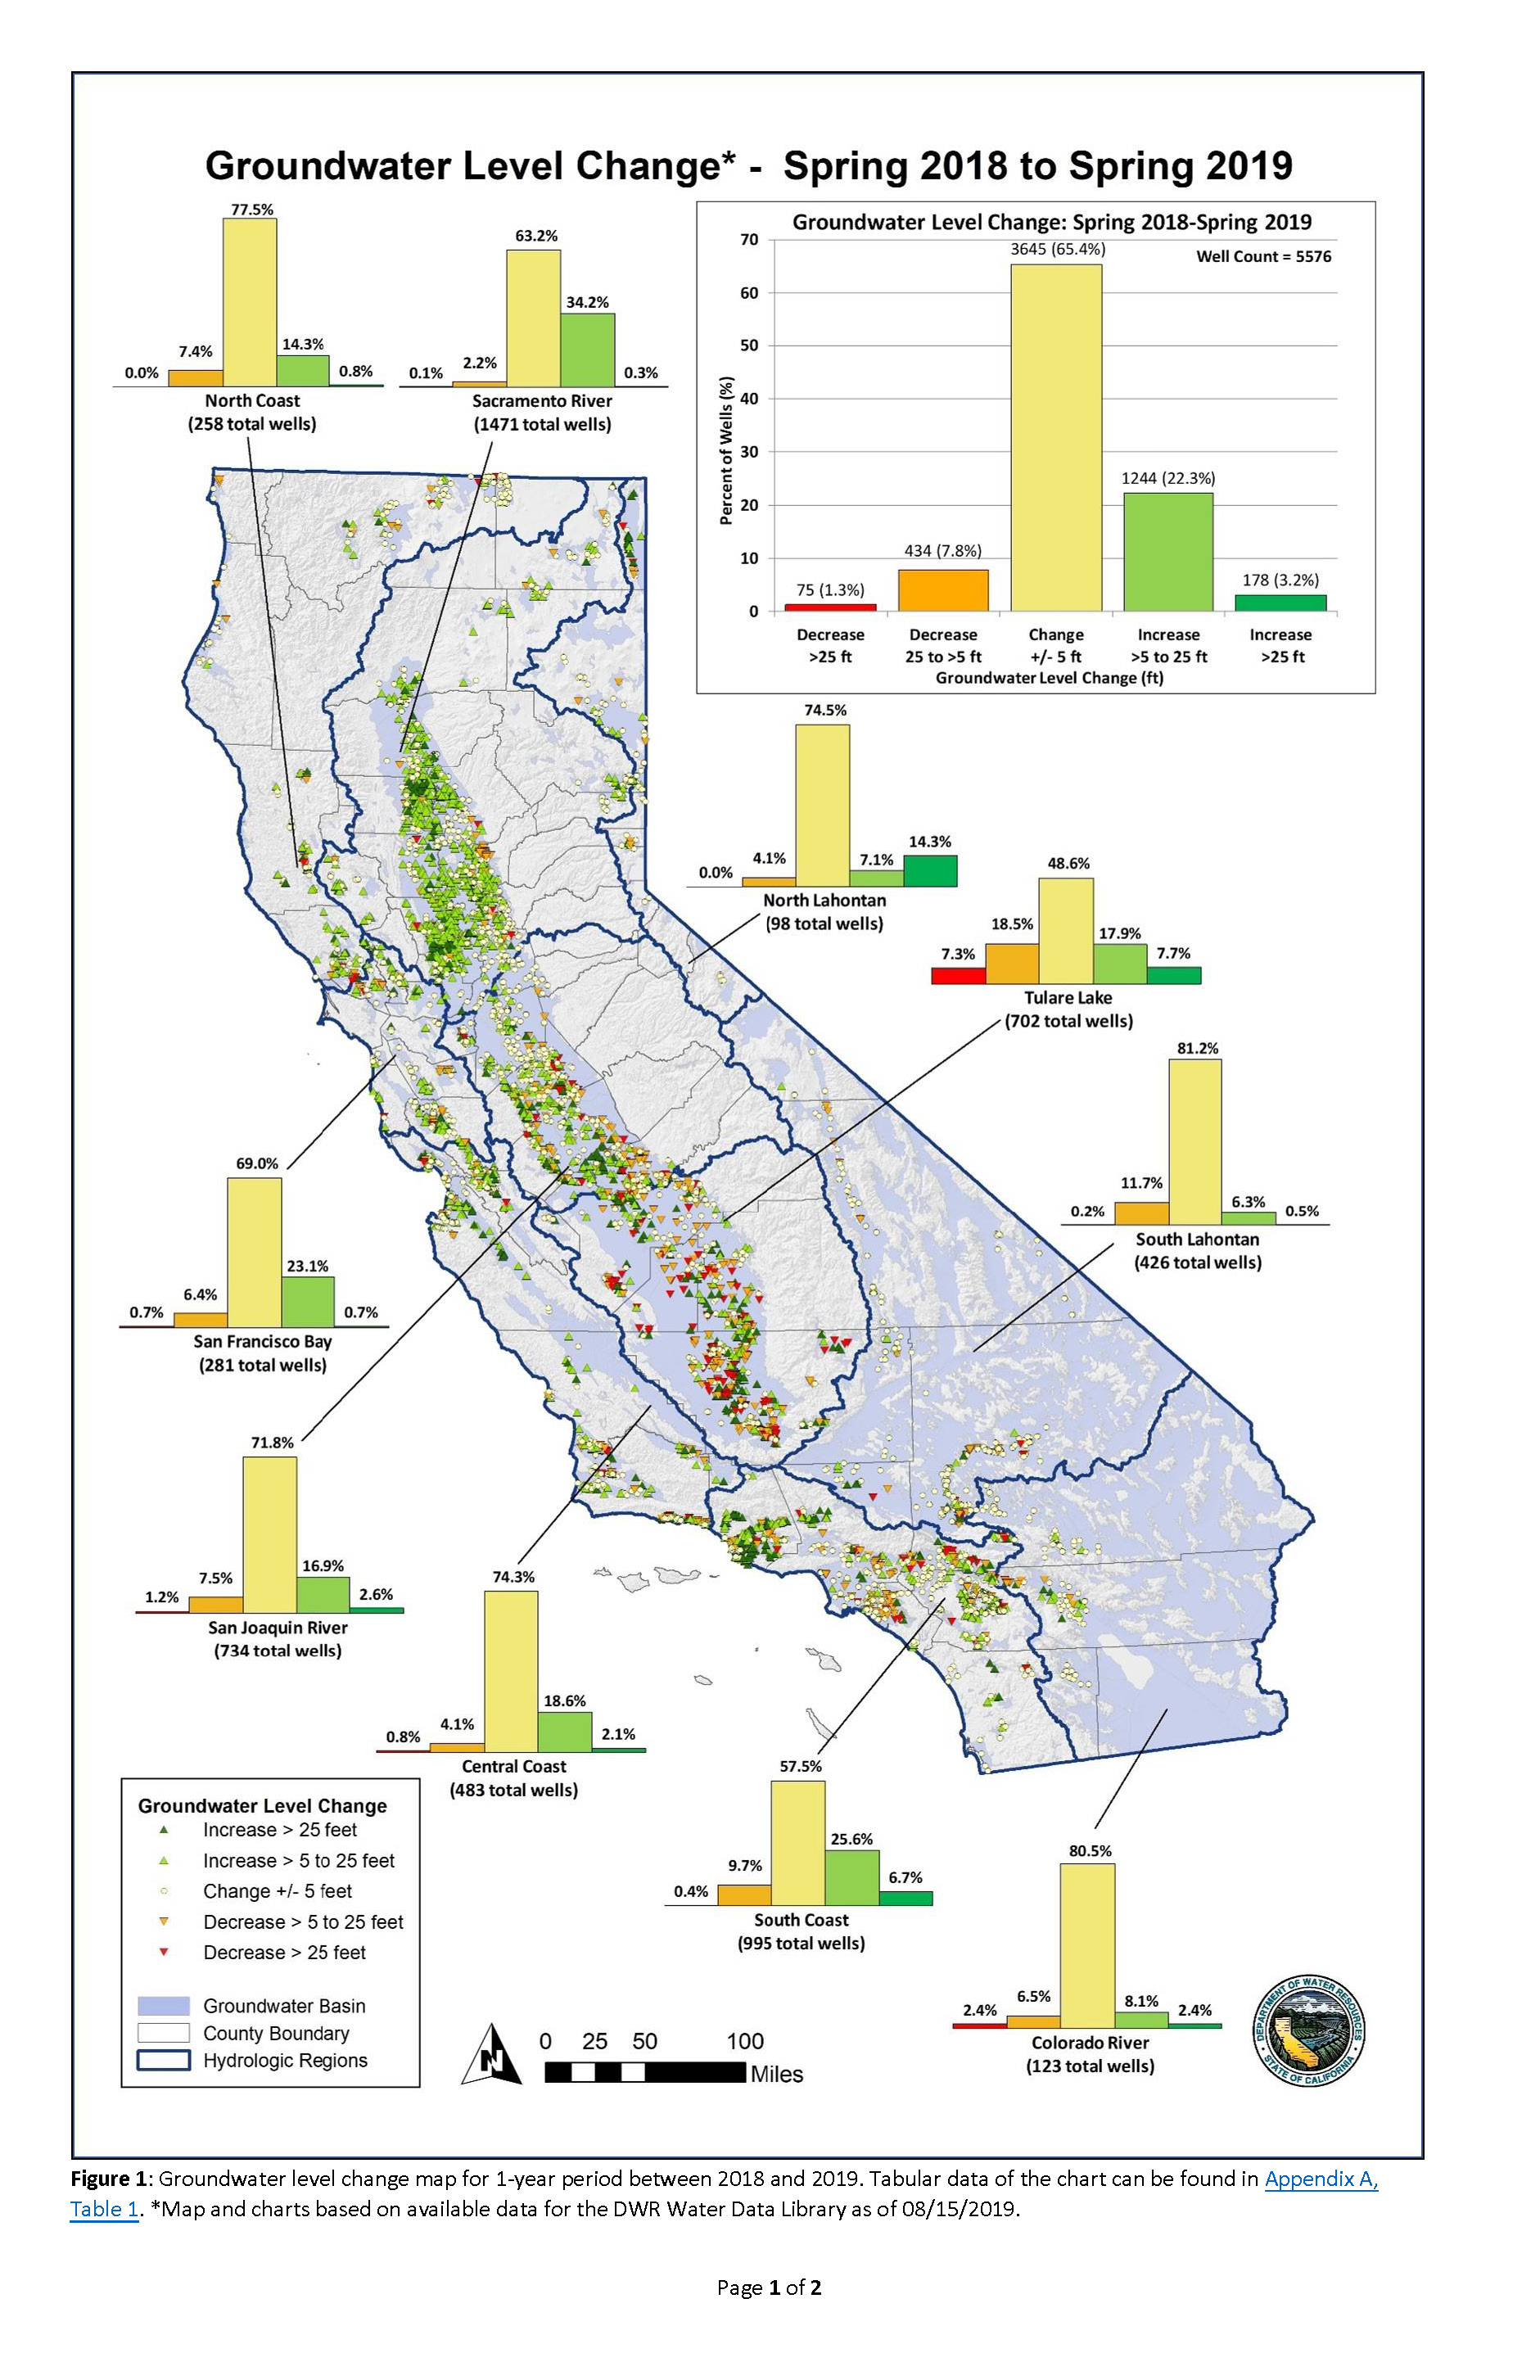
The Department of Water Resources (DWR) produces groundwater level change maps which show groundwater levels in wells throughout the state. When looked at together, these reports give a statewide picture of groundwater conditions and how they change over time – through wet periods or droughts.
Individual groundwater level change reports provide a snapshot of spring and fall groundwater conditions. Spring data is typically collected immediately before the irrigation season begins in a region. This helps show groundwater levels before summer crop irrigation and other uses. The fall levels are taken at the end of the irrigation period. To view the spring 2019 and fall 2019 groundwater level change maps, go to DWR’s Data and Tools webpage, and click on “Maps,” then go to “Statewide Groundwater Level Change Maps.”
Groundwater level change maps are especially important to groundwater sustainability agencies. The maps provide an inside view into local basins which aids in the creation and implementation of groundwater sustainability plans.
DWR staff processes data from thousands of wells to produce groundwater level change reports. This vast monitoring network is made up of a variety of well types including production wells, such as domestic supply wells, and dedicated monitoring wells.
Bill Brewster, senior engineering geologist in DWR’s North Central Region Office, heads the team that plots and checks the data and then issues the twice-a-year reports. Brewster said before joining DWR he worked for a well drilling company which gave him an appreciation for the valuable data wells can provide.
“With issues like subsidence, you can see how groundwater levels affect it. This groundwater level information helps state and local officials manage and continue to monitor land subsidence trends,” he said.
Brewster explained that eight DWR staff members spend weeks pulling all of the data together, reviewing it, and then assembling the maps. He further explained there are hundreds of people from many different agencies throughout the state who are out in the field collecting well data and uploading it to the DWR database.
“Without those people, our dataset would be much smaller,” he added.
Earlier this year, DWR released a report called California Groundwater Conditions Update – Spring 2019, which provides a series of groundwater level change maps, and compares data from previous years to show groundwater level trends, and long term changes. The report shows that after the drought, there were a number of wet years that filled reservoirs, lakes and rivers, and contributed to recovery in groundwater basins. But in some regions, a significant percentage of wells still showed water levels that had not recovered to pre-drought levels.
The report illustrates that groundwater levels may recover fairly quickly in shallow basins that have direct connection with surface water, while other basins may take many years to recover. A one-year comparison of groundwater levels provides information about the short-term effects of a single wet or dry year, while a multi-year comparison of groundwater levels provides information about trends in groundwater storage.
Whether looking at a snapshot of groundwater conditions or the bigger picture of groundwater trends, groundwater level change maps and reports help provide a better understanding of this unseen, yet critically important resource – groundwater.
For more information on groundwater, visit DWR’s SGMA Groundwater Management webpage.